You need five rows and three columns from a query result. The destination is a PR description, a Slack message, or a GitHub issue. You click the first cell, shift-click the last one, press Ctrl+C, switch to the text box, paste, and get a tab-mangled blob with no column headers. The table in the issue looks like someone threw a spreadsheet at a wall.
The other path is worse. You export the entire result to CSV, open it in a spreadsheet, delete the rows and columns you do not need, format it as a Markdown table by hand, and paste. All you wanted was five rows.
Or you need the sum of a column. You highlight the cells, copy, paste into a
spreadsheet, write =SUM(...), read the number, and close the spreadsheet you
never needed.
#Selecting cells in the result grid
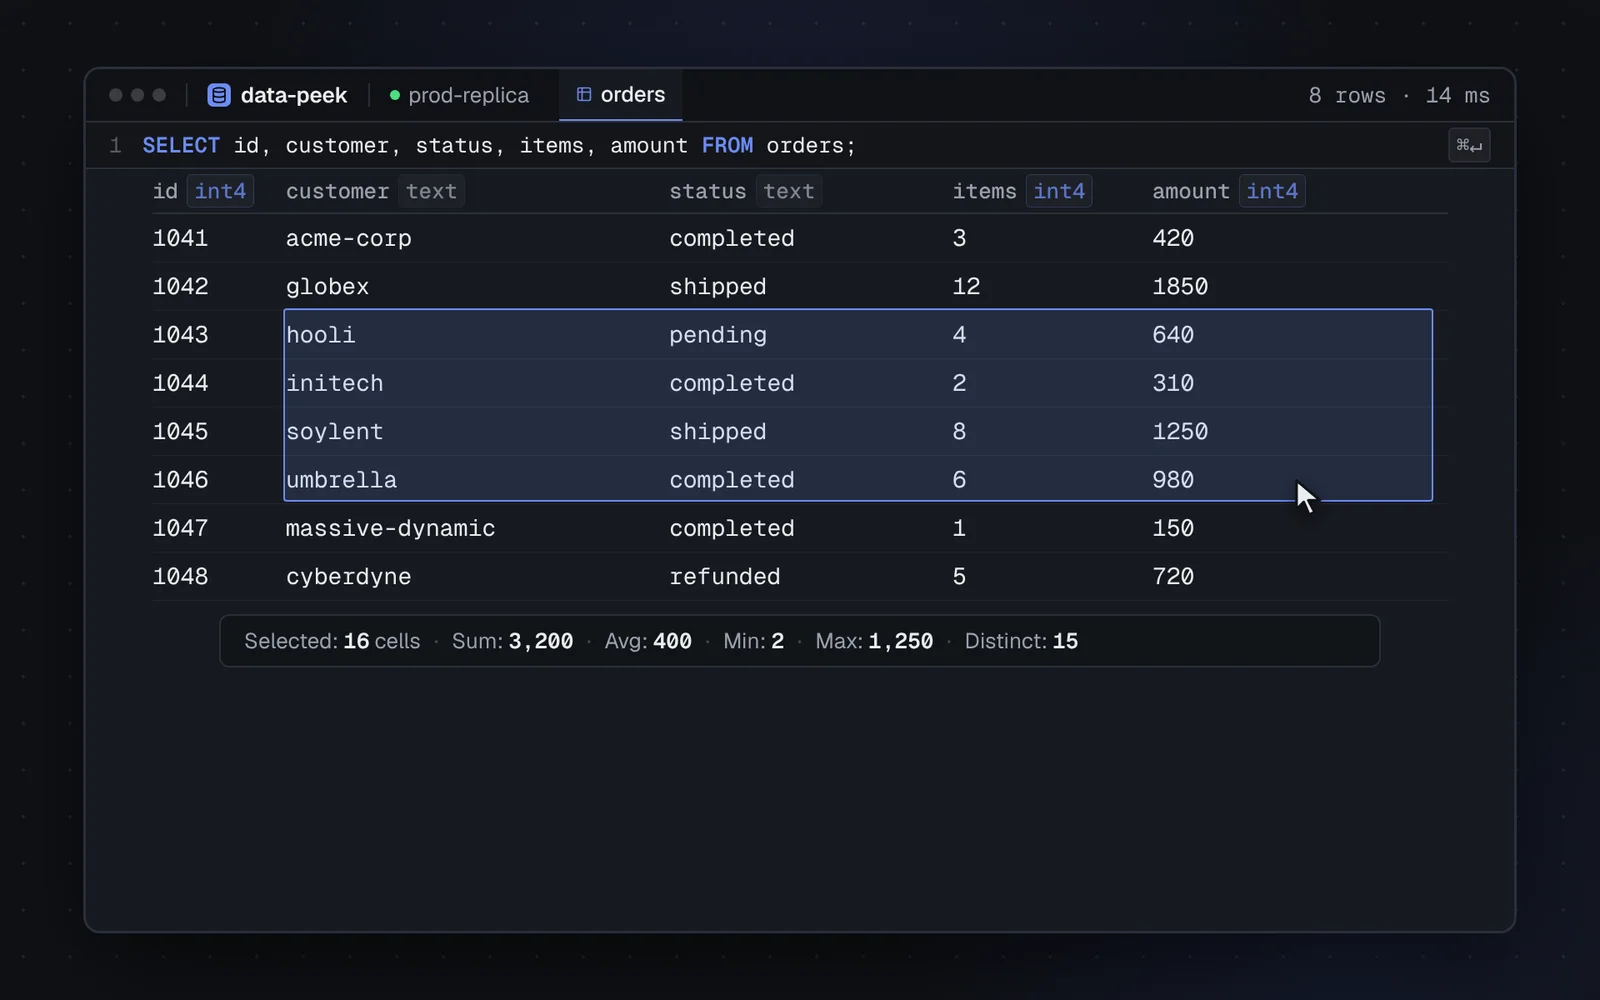
Since v0.39.0, the results grid in data-peek supports multi-cell selection. The model is anchor-plus-active: you click a cell to set the anchor, then extend the selection to an active corner. The grid normalises the two points into an inclusive rectangle regardless of which direction you drag.
The key bindings, confirmed in the source:
| Action | macOS | Windows / Linux |
|---|---|---|
| Extend selection | Shift+↑ ↓ ← → | Shift+↑ ↓ ← → |
| Extend to first / last column | Shift+Home / Shift+End | Shift+Home / Shift+End |
| Extend to first / last cell | Cmd+Shift+Home / Cmd+Shift+End | Ctrl+Shift+Home / Ctrl+Shift+End |
| Extend 20 rows | Shift+PageUp / Shift+PageDown | Shift+PageUp / Shift+PageDown |
| Select all cells on the page | Cmd+A | Ctrl+A |
| Extend to a cell with the mouse | Shift+Click | Shift+Click |
| Add or remove a single cell | Cmd+Click | Ctrl+Click |
| Clear selection | Escape | Escape |
The 20-row page step is a constant in the selection hook:
// apps/desktop/src/renderer/src/components/cell-grid/use-cell-selection.ts
export const PAGE_STEP = 20
The selection is stored as a primary CellRange (anchor + active) plus an
array of additional single-cell ranges added by Cmd/Ctrl+Click. The types
are small:
// apps/desktop/src/renderer/src/components/cell-grid/cell-grid-types.ts
export interface CellRange {
  /** Inclusive anchor cell. */
  anchor: CellPosition
  /** Inclusive far corner. Equals anchor for single-cell selection. */
  active: CellPosition
}

export interface CellSelection {
  /** The primary range — extended by Shift+arrow / Shift+click. */
  primary: CellRange
  /** Additional disjoint ranges added by Cmd/Ctrl+click. */
  additional: CellRange[]
}
Normalisation happens in rangeBounds, which returns r1 ≤ r2 and
c1 ≤ c2 no matter which corner is the anchor:
// apps/desktop/src/renderer/src/components/cell-grid/cell-grid-types.ts
export function rangeBounds(range: CellRange): CellBounds {
  const r1 = Math.min(range.anchor.row, range.active.row)
  const r2 = Math.max(range.anchor.row, range.active.row)
  const c1 = Math.min(range.anchor.col, range.active.col)
  const c2 = Math.max(range.anchor.col, range.active.col)
  return { r1, c1, r2, c2 }
}
The selection overlay draws a div per range, positioned absolutely using
the grid's column offsets and row height. It is pointer-events: none, so
you can still right-click through it to reach the context menu.
#Live stats without a spreadsheet
While more than one cell is selected, a bar appears under the grid. It shows:
- Selected: cell count (always shown)
- Sum, Avg, Min, Max (shown only when at least one selected cell is numeric)
- Distinct (always shown)
- Null with a percentage (shown when at least one null exists)
The stat labels in the UI are Sum:, Avg:, Min:, Max:,
Distinct:, and Null:. Non-numeric selections get only the
count, distinct count, and null count. This covers the "I just need the sum
of this column" case without leaving the app.
The computation iterates every cell in the selection, de-duplicates by
row:col key, and classifies each value:
// apps/desktop/src/renderer/src/components/cell-grid/selection-stats.ts
if (typeof val === 'number' && Number.isFinite(val)) {
  numericCount++
  sum += val
  if (val < min) min = val
  if (val > max) max = val
}
Number.isFinite means NaN and Infinity do not pollute the sum or
average. The average is sum / numericCount, not sum / cellCount, so
a column that mixes numbers and text gives you the numeric average only.
Distinct counting keys on type plus stringified value. Objects are keyed
with obj:${JSON.stringify(val)}, primitives with ${typeof val}:${String(val)}.
Two cells containing the number 1 and the string "1" are distinct.
The stats are debounced at 80ms to avoid blocking while you drag a
selection across a large result. That debounce lives in the
CellSelectionStats component:
// apps/desktop/src/renderer/src/components/cell-grid/cell-selection-stats.tsx
const timer = setTimeout(() => {
  const stats = computeSelectionStats(selection, getCell)
  setComputedStats(stats)
}, debounceMs)
If you have masked columns in
the result, masked cells are counted but skipped for every other stat.
The stats object sets hasMasked: true so the UI could flag it, but
the values are simply not included in the sum or distinct set.
#Copying the selection
Cmd+C / Ctrl+C copies the selection as tab-separated values without
headers. That choice is deliberate, and I come back to why below.
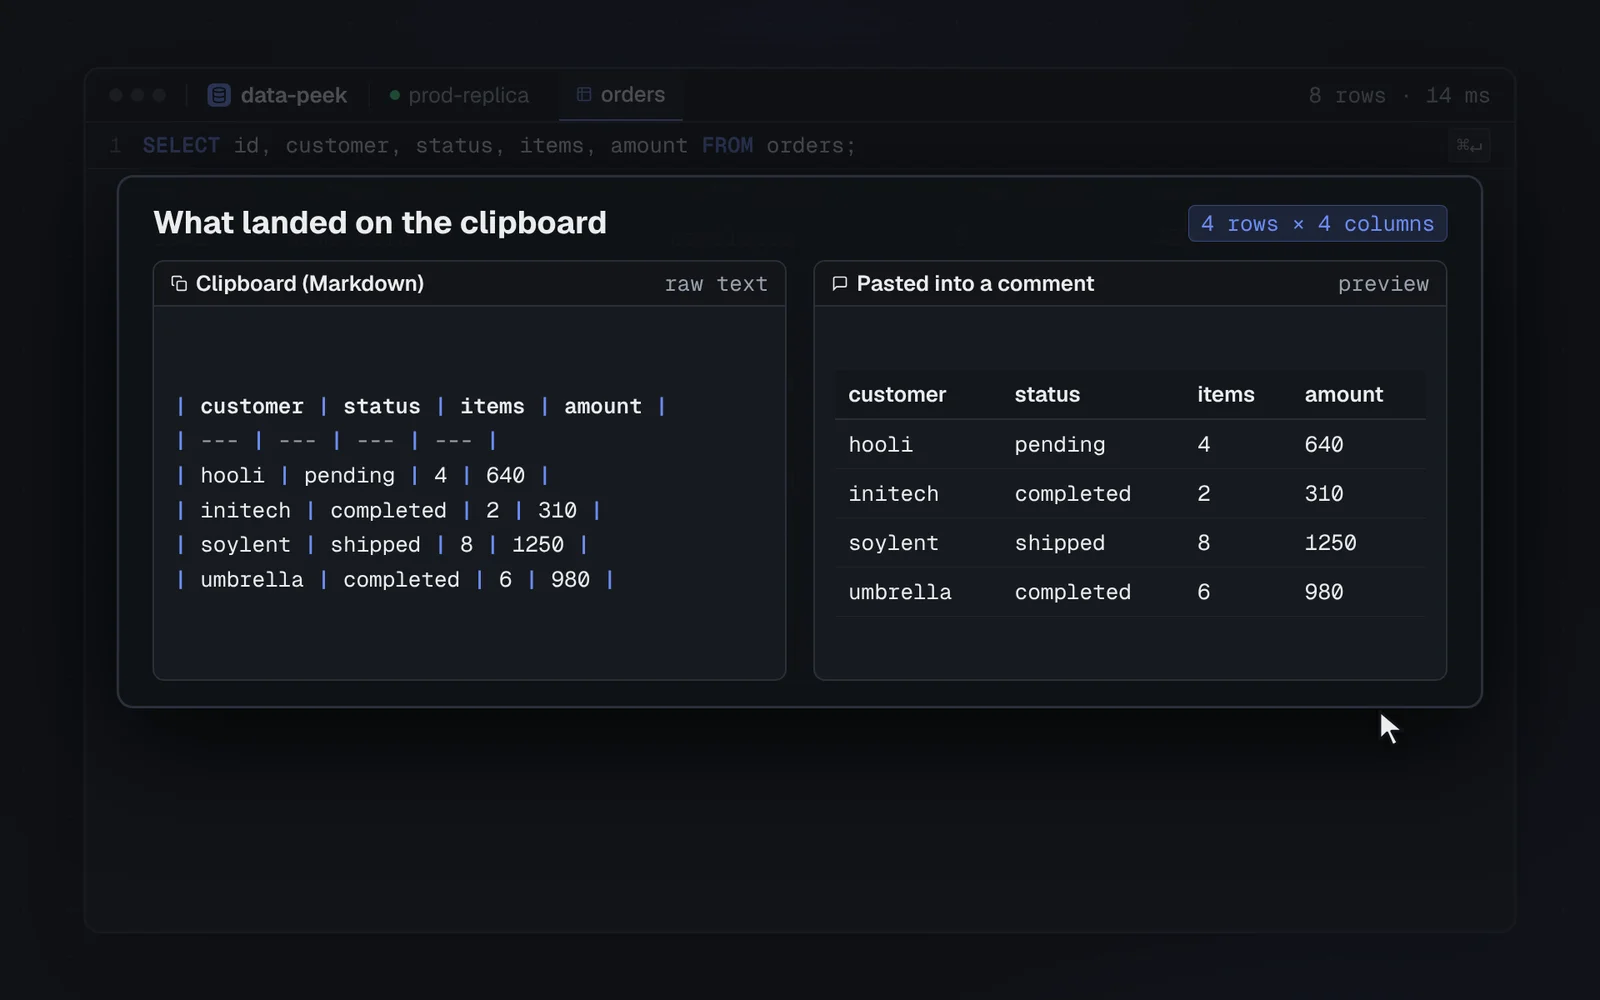
For anything else, right-click inside the selection and open Copy Selection As. The submenu offers five formats, in this order:
| Menu label | Format | Headers |
|---|---|---|
| TSV | Tab-separated | No |
| TSV with headers | Tab-separated | Yes |
| CSV | Comma-separated | Yes |
| JSON | Array of objects | Yes |
| Markdown | Pipe table | Yes |
Those labels and their order come directly from the
SELECTION_COPY_CHOICES array:
// apps/desktop/src/renderer/src/lib/selection-serialize.ts
export const SELECTION_COPY_CHOICES: ReadonlyArray<SelectionCopyChoice> = [
  { label: 'TSV', format: 'tsv', includeHeaders: false },
  { label: 'TSV with headers', format: 'tsv', includeHeaders: true },
  { label: 'CSV', format: 'csv', includeHeaders: true },
  { label: 'JSON', format: 'json', includeHeaders: true },
  { label: 'Markdown', format: 'markdown', includeHeaders: true }
]
After a copy, a floating pill flashes near the cell. If you copied more than one cell, it reads "copied 12 cells". If the format is not the default TSV, it appends the name in parentheses, so you see "copied 12 cells (Markdown)" or "copied 12 cells (JSON)":
// apps/desktop/src/renderer/src/components/cell-grid/copy-flash.tsx
{event.count && event.count > 1 ? `copied ${event.count} cells` : 'copied'}
{event.label ? ` (${event.label})` : null}
One thing to note: copy always serialises the primary rectangular range.
Cells added with Cmd/Ctrl+Click (the additional ranges) are not
included, because a sparse scatter of cells does not map to a table
geometry. The serialiser says so in a comment:
// apps/desktop/src/renderer/src/lib/selection-serialize.ts
// Always serialize only the primary range (sparse selections are ambiguous in table geometry)
const { r1, c1, r2, c2 } = rangeBounds(selection.primary)#Escaping rules per format
Each format has its own escaping, and getting any of them wrong means a broken paste. Here is what each serialiser does.
TSV. If a cell value contains a tab, newline, carriage return, or double quote, the value is wrapped in double quotes and inner quotes are doubled. NULLs become empty strings. This follows the same convention spreadsheets use when pasting from the clipboard.
CSV. The trigger characters are comma, newline, carriage return, and double quote. Same quoting rule: wrap and double the inner quotes. This is RFC 4180 quoting. Tabs inside a value are left as-is because they are not special in CSV.
Markdown. Pipes are escaped with a backslash (\|), and newlines
are replaced with a space. A cell containing line 1\nline 2 becomes
line 1 line 2 because a literal newline would break the table row.
JSON. With headers, each row becomes an object keyed by column name.
Without headers, each row is an array of raw values. null and
undefined both become JSON null. Duplicate column names are
disambiguated by appending _2, _3, etc. The serialiser even handles
__proto__ safely by using Object.defineProperty instead of
assignment, which the test suite confirms.
A small concrete example. Given a selection of two rows and two columns:
| id | name |
|---|---|
| 1 | Alice |
| 2 | Bob |
Copying as Markdown puts this on the clipboard:
| id | name |
| --- | --- |
| 1 | Alice |
| 2 | Bob |
Paste that into a GitHub issue or a PR description and it renders as a table. No spreadsheet, no manual pipe-typing.
#Masked columns copy as empty
If you have PII masking enabled,
masked columns copy as null in JSON and as empty strings in every other
format. The cell snapshot sets isMasked: true and the value to null,
so the serialiser never sees the original value. The test suite checks
this explicitly:
// apps/desktop/src/renderer/src/lib/__tests__/selection-serialize.test.ts
it('never emits a masked value in any format', () => {
  for (const choice of SELECTION_COPY_CHOICES) {
    expect(copyAs(choice.label)).not.toContain('example.com')
  }
})
This matters if you are copying results into a public issue tracker. The mask is not just visual; it is enforced at the copy boundary.
#Why Cmd+C stays plain TSV
I considered making the default copy format CSV, or TSV with headers. I kept it as plain TSV without headers for two reasons.
First, spreadsheets. When you paste TSV into Google Sheets, Numbers, or Excel, each tab becomes a column boundary and each newline becomes a row. That is the universal clipboard contract for tabular data. CSV in the clipboard would paste as a single column of comma-separated text because the spreadsheet does not parse the clipboard as a CSV file.
Second, friction. If you are pasting into Slack, a header row you did not ask for is noise. The right-click menu is one click away when you want headers, and you get to pick the format at the same time. The default should do the least surprising thing.
#What I'd do differently
Stats could stream. The current implementation iterates every cell in one pass after an 80ms debounce. For a selection covering thousands of cells, that pass is fast enough in practice, but it blocks the main thread. A better approach would be to compute in a web worker, or at least yield to the event loop every few hundred cells. It has not been a problem at the result sizes I use, but it is the honest fix.
Sparse copy should work. Right now, Cmd/Ctrl+Click cells are excluded from copy because the serialiser cannot map a scatter of cells to a rectangular table. But there is a reasonable fallback: copy each additional cell as a separate row, one value per row, appended after the primary range. I left it out because the ambiguity felt worse than the limitation, but it would be useful for cherry-picking individual values across a result.
The common formats deserve a shortcut. Right-click, hover "Copy Selection As", click "Markdown" is three interactions. A keyboard shortcut (something like Cmd+Shift+M) for the most common non-default format would cut it to one. I have not added it yet because I am not sure which format deserves the shortcut. If you do this kind of copy often and already use the keyboard for the grid, you will feel the gap.
#If you want to try it
The selection, copy, and stats shipped in v0.39.0 and v0.39.1. The
source files are in apps/desktop/src/renderer/src/components/cell-grid/
and apps/desktop/src/renderer/src/lib/selection-serialize.ts. If you
want to export entire result sets rather than selections,
the full export is a separate path.
data-peek is at datapeek.dev. Free for personal use, MIT source. If you have ever pasted a query result into a spreadsheet just to sum a column, this is why the feature exists.