It was 11:47 PM when the Datadog alert came in. API latency on /checkout had
tripled. I SSH'd into the bastion, opened psql, and started typing the query
I have typed a thousand times:
SELECT pid, state, EXTRACT(EPOCH FROM (now() - query_start)) AS seconds, query
FROM pg_stat_activity
WHERE state != 'idle'
ORDER BY query_start;
Then I ran it. Then I ran it again six seconds later. Then again. Then I
opened a second tab and started typing SELECT * FROM pg_locks because I was
pretty sure one of the long-running queries was blocking something. Three
terminals, two SSH sessions, one increasingly tired human.
Every Postgres operator has been here. The data you need lives in system
views — pg_stat_activity, pg_locks, pg_statio_user_tables,
pg_stat_user_tables. Reaching for them through a shell at midnight is a
productivity tax I got tired of paying.
So I built the Connection Health Monitor into data-peek.
#What it does
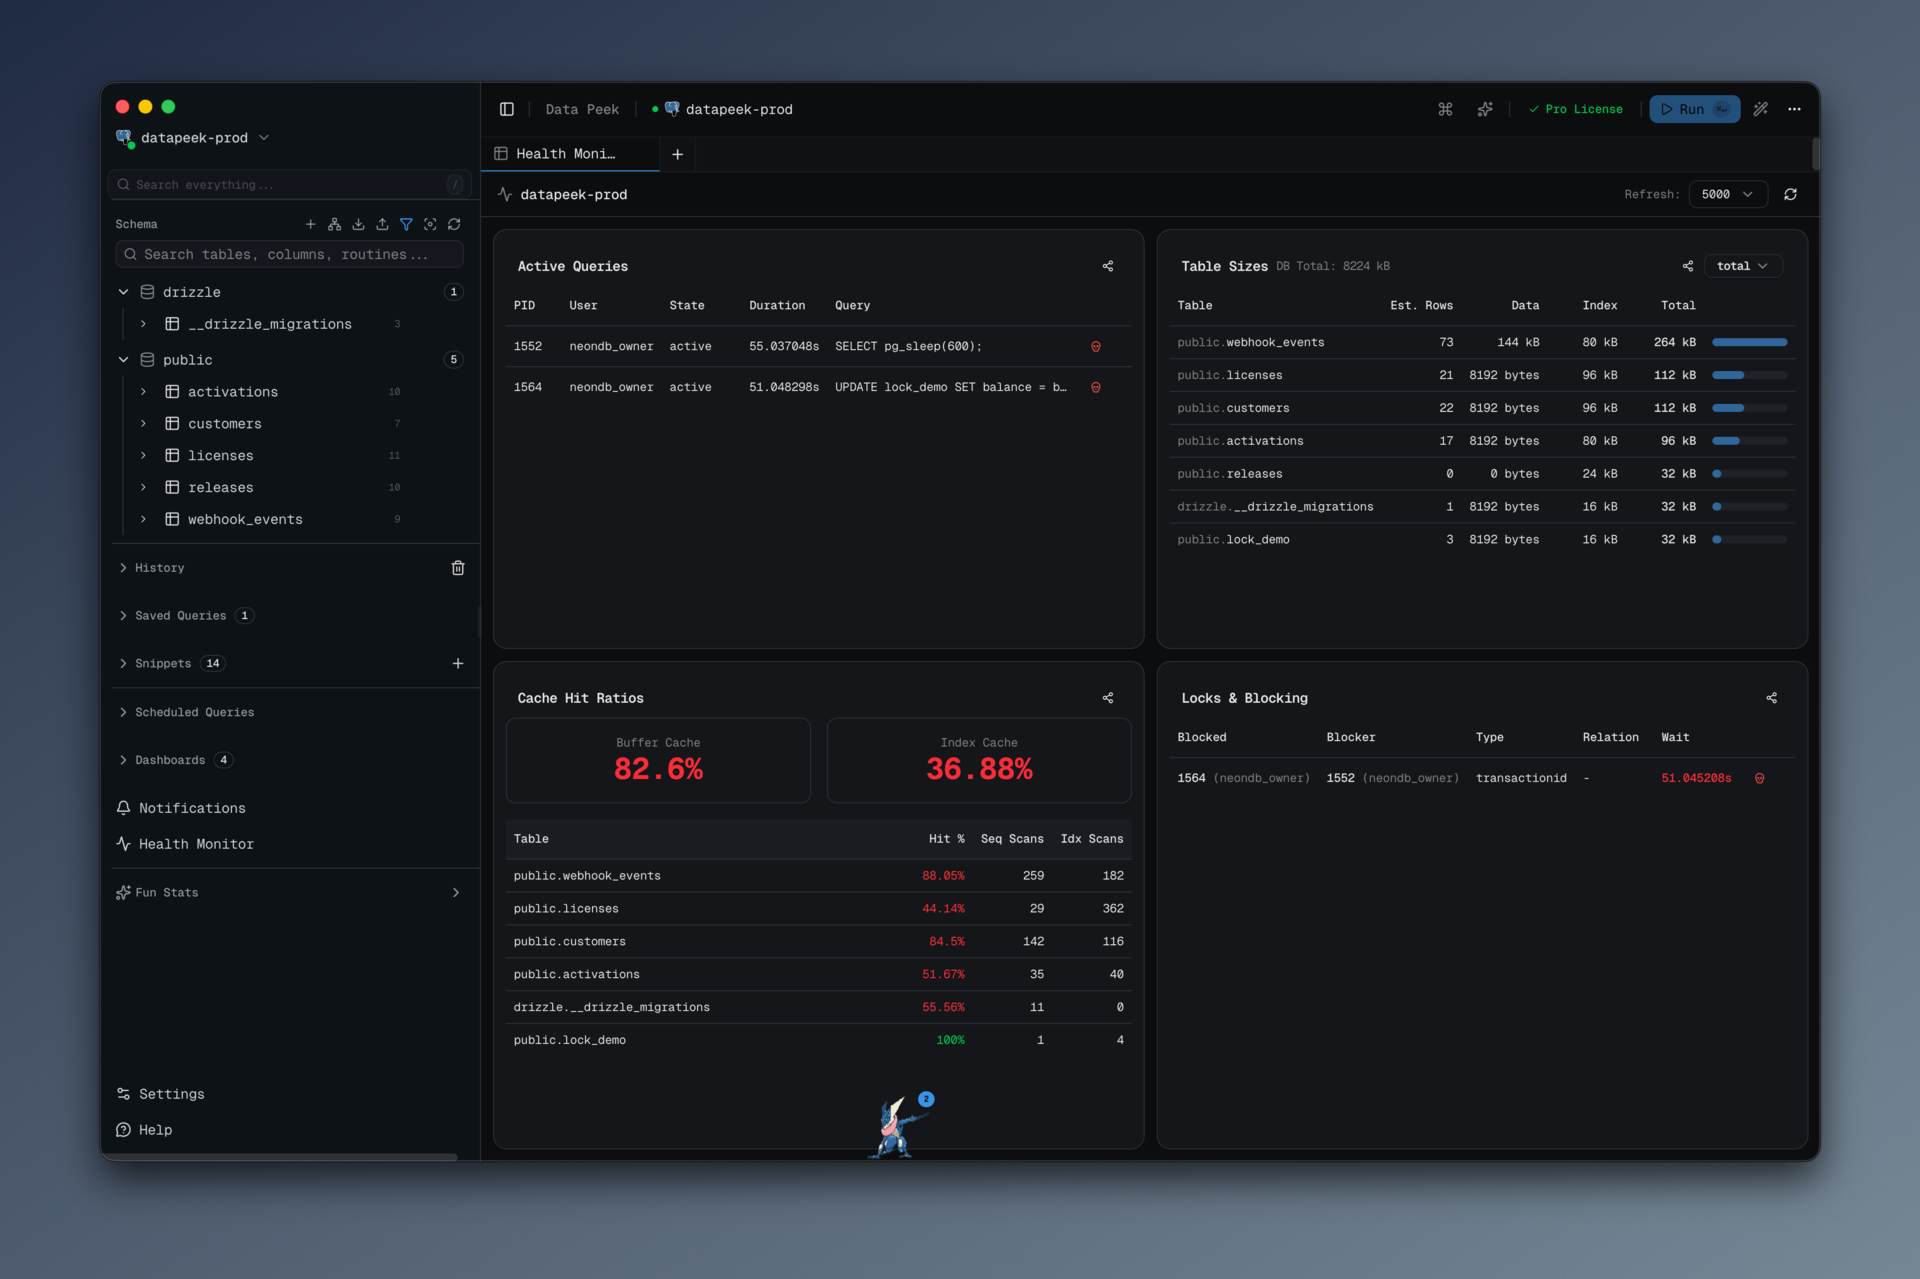
The Health Monitor is a dedicated tab — not a modal, not a sidebar — that refreshes every 2, 5, 10, or 30 seconds (configurable), and shows four panels:
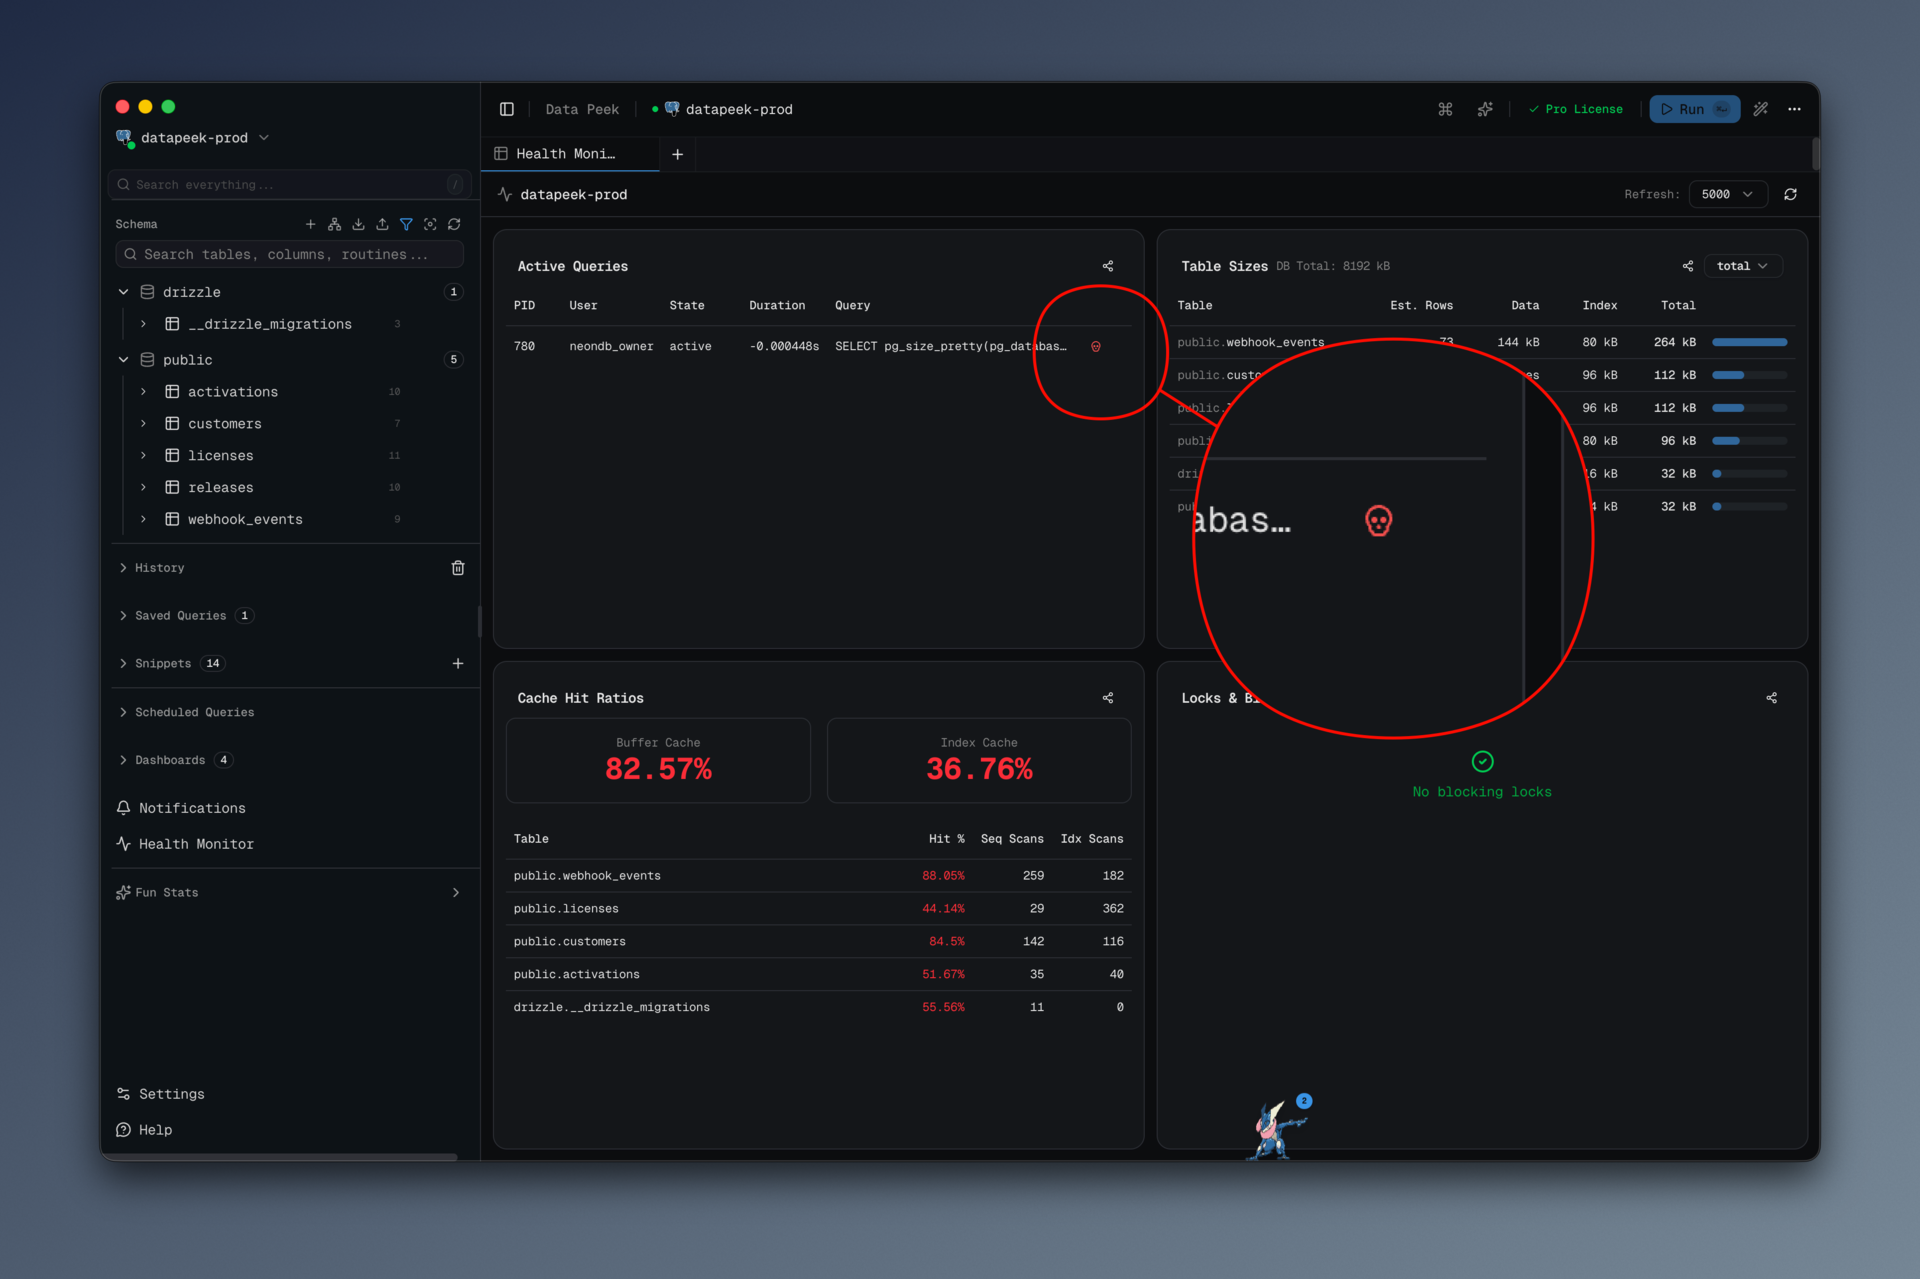
- Active Queries — everything in
pg_stat_activitythat isn't idle, with duration, wait events, and a kill button next to each row. - Table Sizes — the top 50 tables by total size, including heap and index
bytes, with a row-count estimate from
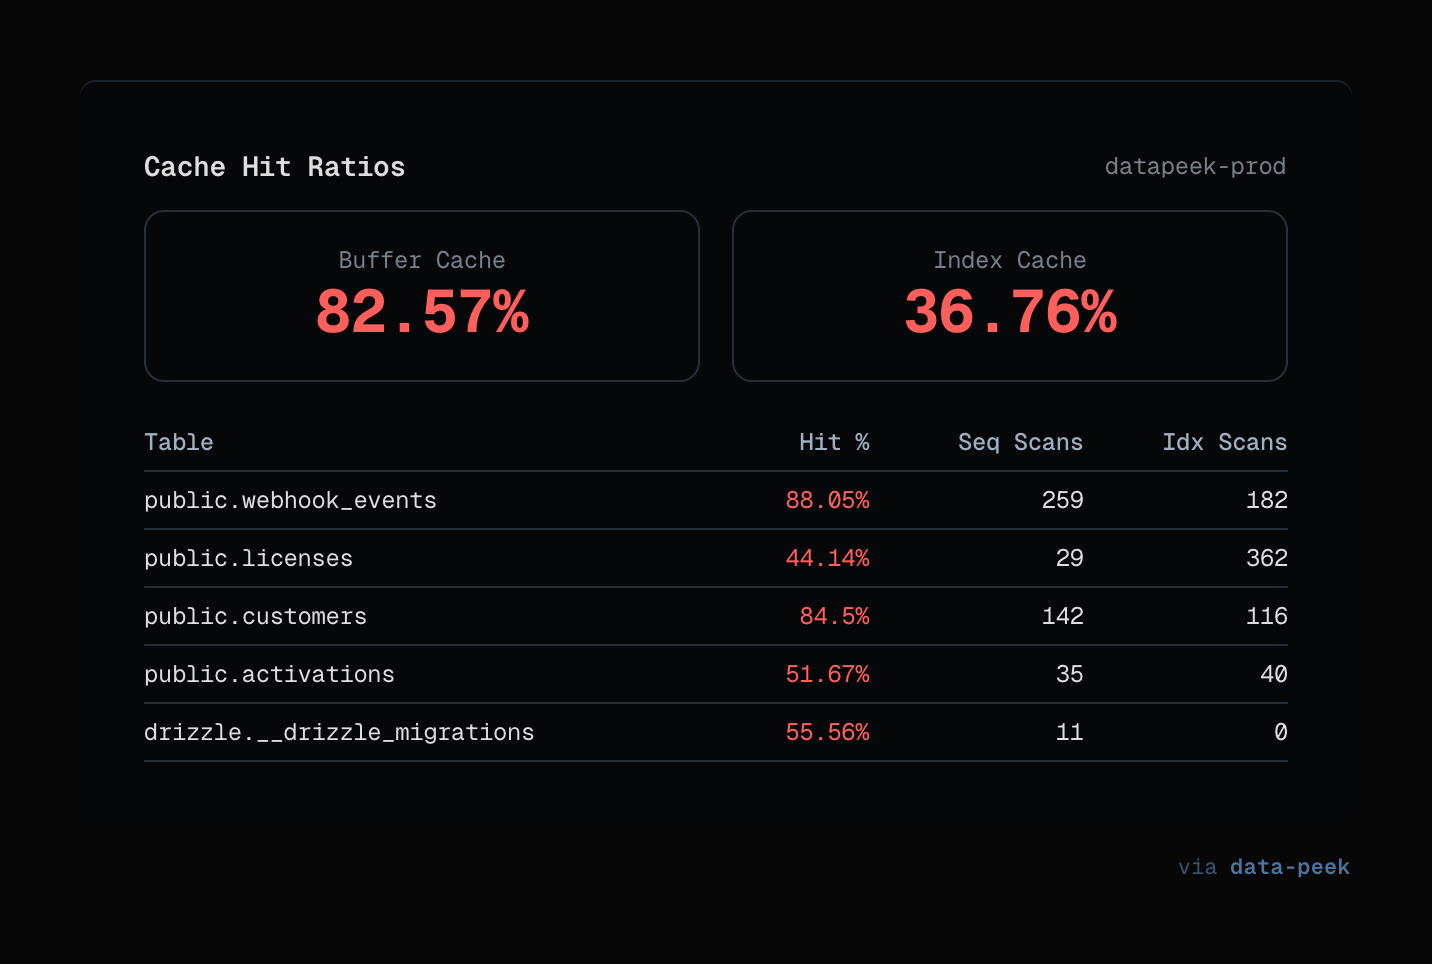
pg_stat_user_tables.n_live_tup. - Cache Hit Ratios — buffer and index cache hit percentages, plus a per-table breakdown of seq-scan vs index-scan counts.
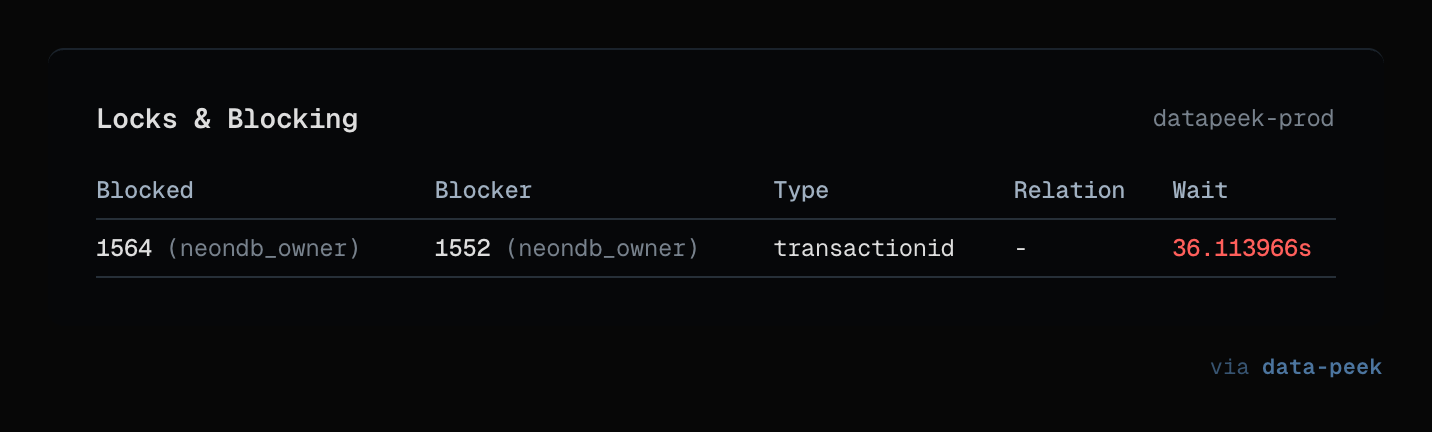
- Locks & Blocking — the classic blocked/blocking join from
pg_locks, with both the blocked query and the query holding the lock visible side by side.
The kill button calls pg_cancel_backend(pid). No confirmation dialog. If
you hit it by accident, the worst that happens is a query fails and you run
it again. That is the right tradeoff at midnight.
Every panel has a "Share" button that generates a clean screenshot suitable for pasting into an incident Slack channel. That last bit came from a real incident where I wanted to show the on-call DBA what I was seeing and ended up cropping and masking a terminal screenshot for ten minutes. Now it is a single click.
#How it's wired
The Health Monitor is an honest, boring pipeline, and I think that is the point.
┌────────────────────────────┐
│  HealthMonitor.tsx (React) │  ← refresh interval, kill buttons, share UI
└──────────────┬─────────────┘
               │ window.api.db.*
┌──────────────┴─────────────┐
│  health-handlers.ts (IPC)  │  ← ipcMain.handle('db:active-queries', …)
└──────────────┬─────────────┘
               │ getAdapter(config)
┌──────────────┴─────────────┐
│  postgres-adapter.ts       │  ← the actual SQL against pg_stat_*
└────────────────────────────┘
The IPC handlers (src/main/ipc/health-handlers.ts) are wafer-thin — each
one is about ten lines, dispatches to the adapter, and wraps the result in
the project's standard IpcResponse<T> shape:
ipcMain.handle("db:active-queries", async (_, config: ConnectionConfig) => {
  try {
    const adapter = getAdapter(config);
    const queries = await adapter.getActiveQueries(config);
    return { success: true, data: queries } as IpcResponse<typeof queries>;
  } catch (error) {
    log.error("Failed to get active queries:", error);
    return { success: false, error: String(error) } as IpcResponse<never>;
  }
});
That pattern ensures every health panel can fail independently. If pg_locks
is slow because something dramatic is happening, the Active Queries panel
still refreshes on its own schedule.
##The SQL, unvarnished
The thing dev.to tutorials usually hide — the actual SQL — is the part I find
most useful. Here is the query powering the Active Queries panel, straight
from src/main/adapters/postgres-adapter.ts:
SELECT
  pid,
  usename AS user,
  datname AS database,
  state,
  COALESCE(
    EXTRACT(EPOCH FROM (now() - query_start))::text || 's',
    '0s'
  ) AS duration,
  COALESCE(EXTRACT(EPOCH FROM (now() - query_start)) * 1000, 0)::bigint AS duration_ms,
  query,
  wait_event_type || ':' || wait_event AS wait_event,
  application_name
FROM pg_stat_activity
WHERE state != 'idle'
  AND pid != pg_backend_pid()
  AND query NOT LIKE '%pg_stat_activity%'
ORDER BY query_start ASC NULLS LAST
Two details worth calling out:
pid != pg_backend_pid()filters out the monitoring query itself. Without this, you spend ten minutes wondering why there is always a query running.query NOT LIKE '%pg_stat_activity%'is a belt-and-braces filter for the case where another client is ALSO polling this view. When I skipped it, the dashboard kept showing "the monitoring client is monitoring itself."
The cache-hit ratio query is where people usually copy-paste wrong:
SELECT
  CASE WHEN SUM(heap_blks_hit) + SUM(heap_blks_read) = 0 THEN 0
    ELSE ROUND(SUM(heap_blks_hit)::numeric / (SUM(heap_blks_hit) + SUM(heap_blks_read)) * 100, 2)
  END AS buffer_cache_hit_ratio,
  CASE WHEN SUM(idx_blks_hit) + SUM(idx_blks_read) = 0 THEN 0
    ELSE ROUND(SUM(idx_blks_hit)::numeric / (SUM(idx_blks_hit) + SUM(idx_blks_read)) * 100, 2)
  END AS index_hit_ratio
FROM pg_statio_user_tables
The CASE guards against division by zero on freshly restarted databases.
Without them, the panel shows NaN% for the first few minutes after a
restart, which is exactly when you are most likely to be looking at it.
##The lock detection join
The Locks panel is the only query I am genuinely proud of. The canonical
"blocked by whom" join in Postgres is notoriously ugly because pg_locks
does not give you a single "blocker pid" column — you have to self-join on
every distinguishing column:
FROM pg_locks blocked
JOIN pg_stat_activity blocked_activity  ON blocked.pid = blocked_activity.pid
JOIN pg_locks blocking ON (
  blocked.locktype       = blocking.locktype
  AND blocked.database   IS NOT DISTINCT FROM blocking.database
  AND blocked.relation   IS NOT DISTINCT FROM blocking.relation
  AND blocked.page       IS NOT DISTINCT FROM blocking.page
  AND blocked.tuple      IS NOT DISTINCT FROM blocking.tuple
  AND blocked.virtualxid IS NOT DISTINCT FROM blocking.virtualxid
  AND blocked.transactionid IS NOT DISTINCT FROM blocking.transactionid
  AND blocked.classid    IS NOT DISTINCT FROM blocking.classid
  AND blocked.objid      IS NOT DISTINCT FROM blocking.objid
  AND blocked.objsubid   IS NOT DISTINCT FROM blocking.objsubid
  AND blocked.pid != blocking.pid
)
JOIN pg_stat_activity blocking_activity ON blocking.pid = blocking_activity.pid
WHERE NOT blocked.granted AND blocking.granted
IS NOT DISTINCT FROM is the operator that treats NULL = NULL as true,
which matters because most of these columns are NULL for any given lock type.
If you use plain = here, the join silently returns zero rows and you
conclude that nothing is blocking anything. Ask me how I know.
#The kill button
async killQuery(config, pid) {
  const client = new Client(buildClientConfig(config, tunnelOverrides))
  await client.connect()
  const result = await client.query('SELECT pg_cancel_backend($1) AS cancelled', [pid])
  const cancelled = result.rows[0]?.cancelled === true
  return cancelled
    ? { success: true }
    : { success: false, error: 'Failed to cancel query - process may have already completed' }
}
pg_cancel_backend sends SIGINT to the backend process. It is the polite
version — pg_terminate_backend is the hammer, and I deliberately do not
expose it from the UI because killing a backend mid-transaction is a foot-gun
that no amount of confirm dialogs can save you from. If pg_cancel_backend
fails to stop the query, the assumption is that you want to keep looking
before escalating.
#What I'd do differently
Two things I regret.
First, I hard-coded LIMIT 50 in the Table Sizes query. It was fine for my
own databases. Then someone with 12,000 tables opened the panel and their
disk groaned for nine seconds before anything appeared. A parameterized limit
with a default would have saved that. I will get to it.
Second, the refresh interval is per-panel but the polling is not staggered. When all four panels refresh at 2s, they all fire at the same tick, and a slow database sees four simultaneous connections every two seconds. Staggering them by 500ms each would be gentler on the server. Classic premature optimization trap — I built the simple version, shipped it, and only noticed when a coworker complained.
#Try it
If you want to see the Health Monitor without downloading anything, the
screenshots are in the data-peek README.
The code for this feature lives in src/renderer/src/components/health-monitor.tsx
and src/main/adapters/postgres-adapter.ts.
The app itself is at datapeek.dev — MIT source, free for personal use, one-time license for commercial. I would rather you read the SQL than click the download button, honestly. If it is the kind of thing you'd want in your toolbox, the download is one click from there.