Here is a trap I have fallen into more times than I can count.
I write a query. I run it. It takes 48ms. I nod, satisfied, and deploy it. In production it p99s at 1.8 seconds during peak traffic, the on-call engineer pages me, and I spend the next hour explaining how "on my machine it was fine."
A single EXPLAIN ANALYZE run is not a benchmark. It is an anecdote. The
first run pays the cost of cold caches, parse, plan, and whatever else the
database had queued. The second run is suspiciously fast because everything
is now in the buffer cache. Somewhere between "ran it once in psql" and
"ran it under real load" lives the actual distribution of latencies — and
that distribution is what matters.
The traditional fix is an ad-hoc bash loop:
for i in {1..100}; do
  psql -c "\timing" -c "SELECT ... your query ..." \
    | grep 'Time:'
done | awk '{print $2}' | sort -n | ...
And then you remember you do not know the awk incantation for p99 off the top of your head, you open Stack Overflow, you copy something, it gives you the wrong percentile, you mutter, and you give up.
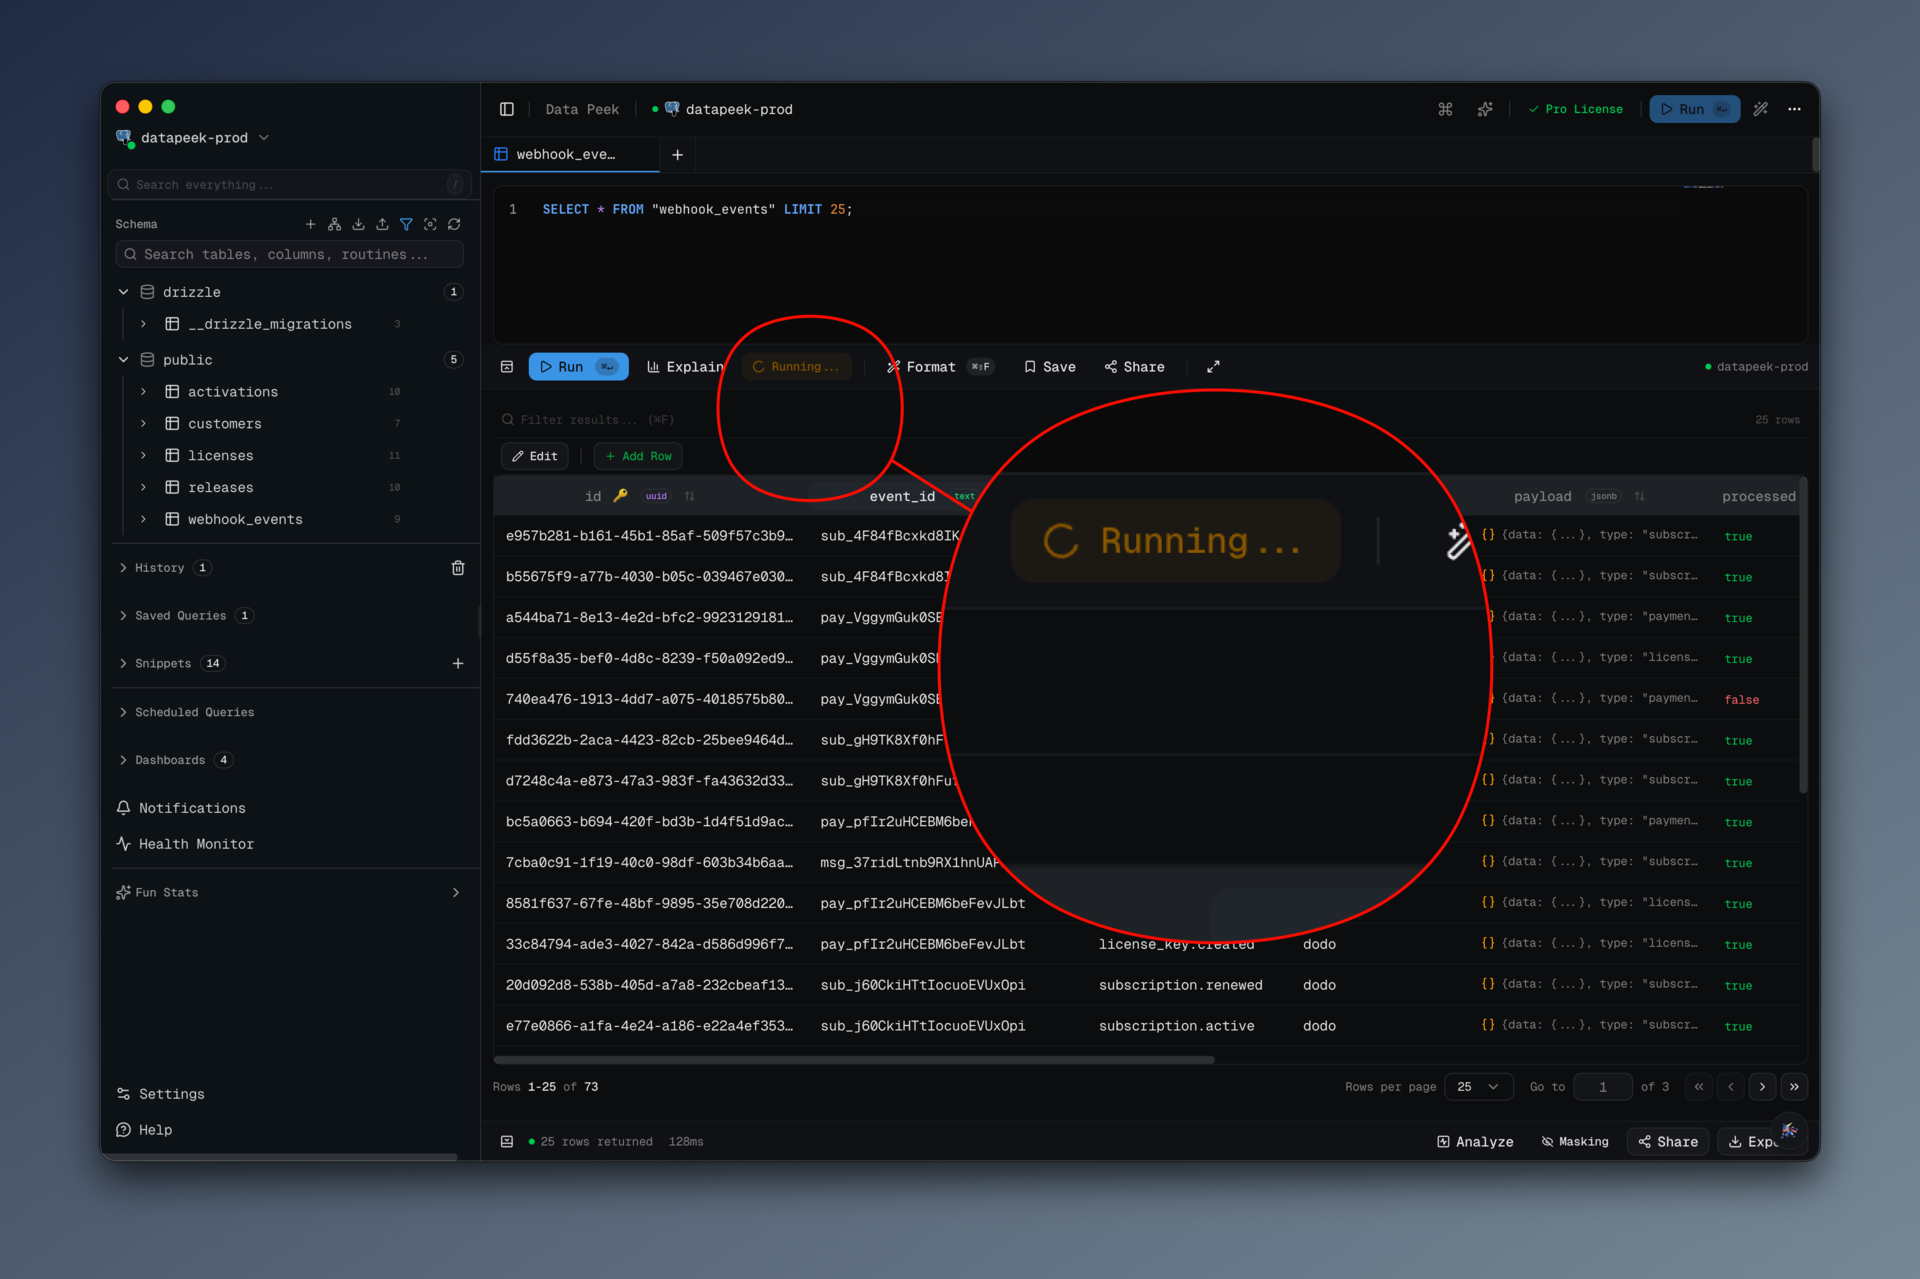
data-peek has a Benchmark button. Click it, pick how many runs, wait, read the percentiles. That is the whole interaction.
#What you get
The button (src/renderer/src/components/benchmark-button.tsx) is a dropdown
with four presets:
const RUN_OPTIONS = [
{ count: 10, label: "10 runs", description: "Quick test" },
{ count: 50, label: "50 runs", description: "Standard benchmark" },
{ count: 100, label: "100 runs", description: "Detailed analysis" },
{ count: 500, label: "500 runs", description: "Statistical precision" },
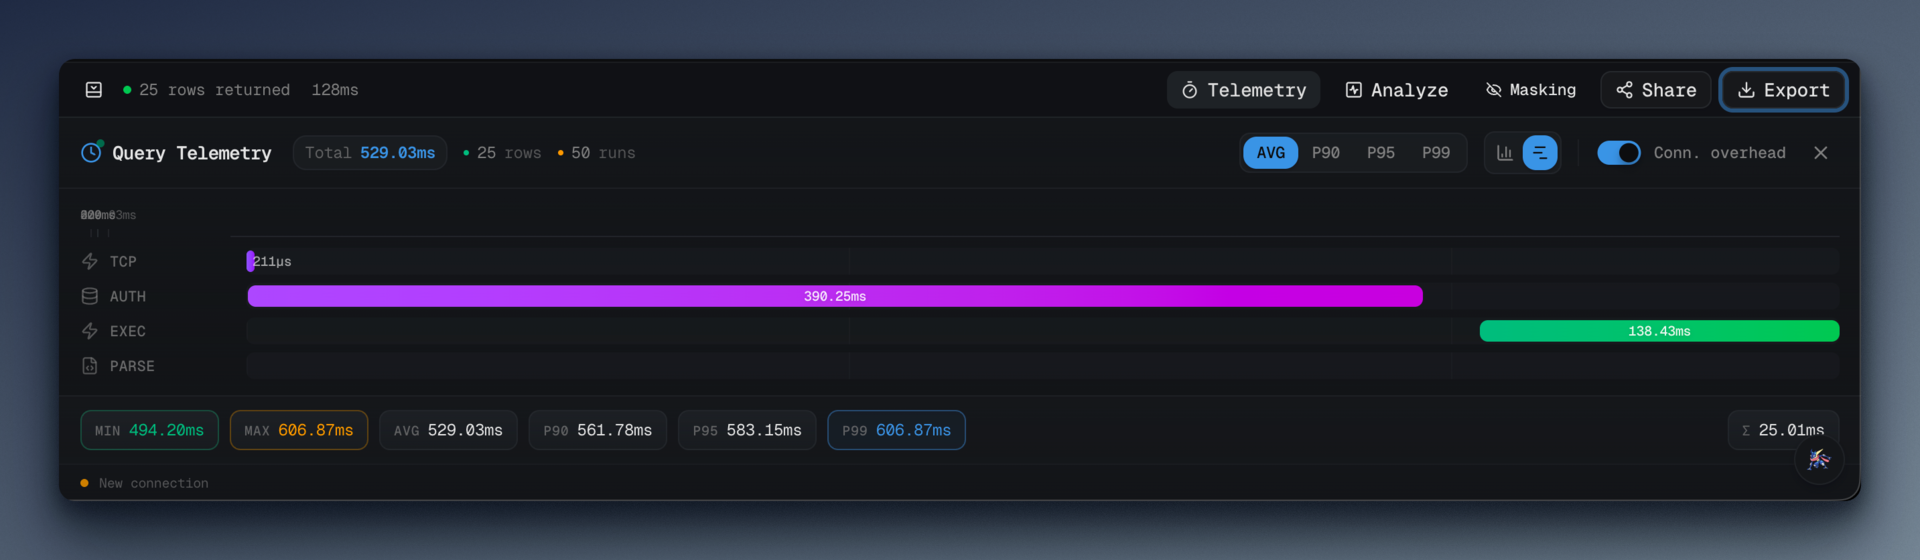
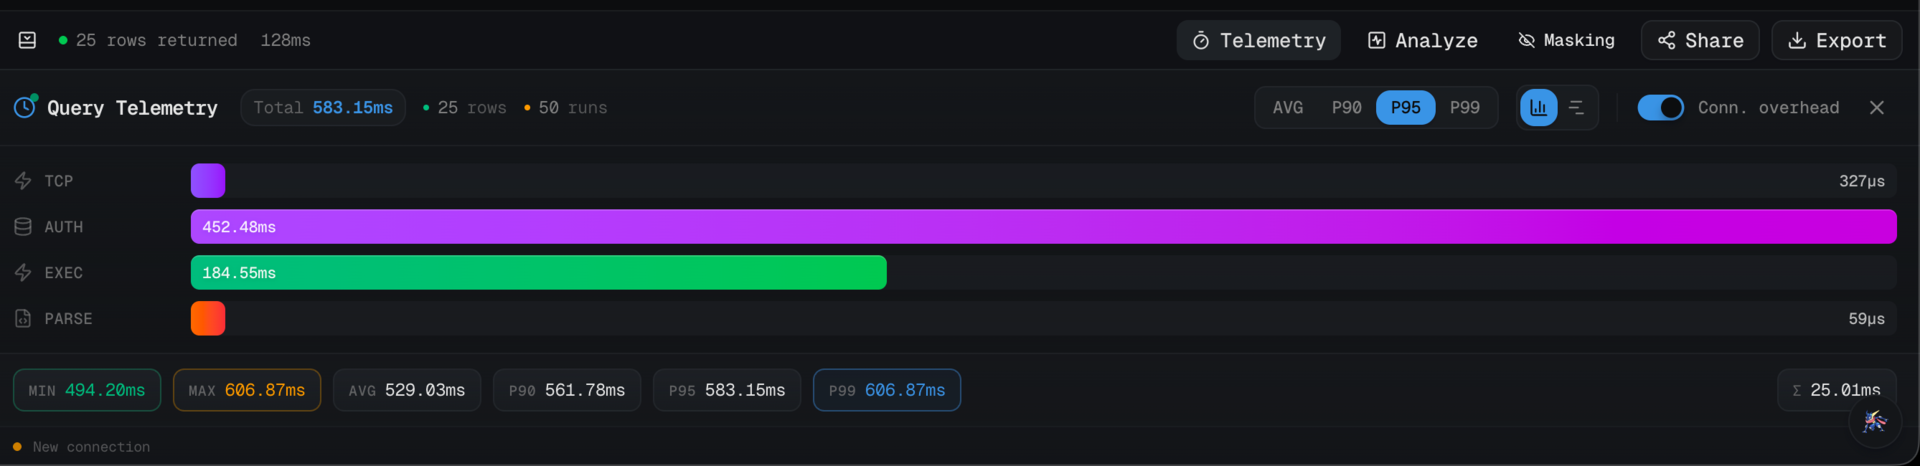
];Pick one, the currently open query runs that many times, and the results panel updates with:
- Average, min, max latency
- p90, p95, p99 latency
- Standard deviation (the shape of the distribution matters; a query with 40ms average and 200ms std dev is a different beast than one with 40ms average and 2ms std dev)
- Per-phase breakdown — connect, plan, execute, fetch — each with its own percentiles
That last one is the difference between "the query is slow" and "the query is fast but the planner is slow." I would not have guessed how often the answer is the second one until I could actually see it.
#How the runs happen
The renderer calls db:benchmark over IPC with a run count, and the main
process loops through the query that many times, collecting telemetry on
each pass. The important bits from src/main/ipc/query-handlers.ts:
ipcMain.handle("db:benchmark", async (_, { config, query, runCount }) => {
  // Validate run count
  if (runCount < 1 || runCount > 1000) {
    return { success: false, error: "Run count must be between 1 and 1000" };
  }

  const adapter = getAdapter(config);
  const telemetryRuns: QueryTelemetry[] = [];

  for (let i = 0; i < runCount; i++) {
    const executionId = `benchmark-${Date.now()}-${i}`;

    try {
      const result = await adapter.queryMultiple(config, query, {
        executionId,
        collectTelemetry: true,
      });

      if (result.telemetry) {
        telemetryRuns.push(result.telemetry);
      }

      // Small delay between runs to avoid overwhelming the database
      if (i < runCount - 1) {
        await new Promise((resolve) => setTimeout(resolve, 10));
      }
    } catch (runError) {
      // If a run fails, log it but continue
      log.warn(`Benchmark run ${i + 1} failed:`, runError);
    }
  }

  if (telemetryRuns.length === 0) {
    return { success: false, error: "All benchmark runs failed" };
  }

  const benchmarkResult = telemetryCollector.aggregateBenchmark(telemetryRuns);
  return { success: true, data: benchmarkResult };
});
Three things I want to point out.
Failed runs do not abort the benchmark. If run 37 out of 100 hits a deadlock and errors, we log it and keep going. At the end, as long as at least one run succeeded, we aggregate. This matters because in a real database, transient failures happen, and throwing away 99 successful runs because one hit a lock is worse than reporting on 99 successes.
There is a 10ms delay between runs. I went back and forth on this. Without it, 500 runs slam the server and you get a warped picture — the later runs start queuing because the server is busy serving the earlier runs. With it, you give the database a breath between iterations and the distribution starts to look like what you would see under spaced-out production traffic. 10ms is a compromise; the correct answer depends on your workload.
collectTelemetry: true is the hook into the per-phase breakdown. The
adapter instruments connect/plan/execute/fetch and returns a
QueryTelemetry per run, which is how we end up with phase-level
percentiles instead of just end-to-end numbers.
#The percentile math
The percentile function is deliberately unfancy. It lives in
packages/shared/src/index.ts so both main and renderer can use the same
implementation:
export function calcPercentile(sorted: number[], p: number): number {
  if (sorted.length === 0) return 0;
  if (sorted.length === 1) return sorted[0];
  const idx = Math.ceil((p / 100) * sorted.length) - 1;
  return sorted[Math.max(0, Math.min(idx, sorted.length - 1))];
}
This is the "nearest-rank" percentile, the definition you learn in stats 101. It is not the interpolated version you get from numpy by default, and it is not the version the Postgres docs use internally. It is the version that matches how most developers intuit percentiles: "p99 is a real value from the dataset, not an interpolated one between two samples." With 500 runs, the difference between nearest-rank and interpolated is in the noise.
The aggregation:
aggregateBenchmark(runs: QueryTelemetry[]): BenchmarkResult {
  const durations = runs
    .map((r) => r.totalDurationMs)
    .sort((a, b) => a - b)
  const sum = durations.reduce((a, b) => a + b, 0)
  const avg = sum / durations.length

  const stats = {
    avg,
    min: durations[0],
    max: durations[durations.length - 1],
    p90: calcPercentile(durations, 90),
    p95: calcPercentile(durations, 95),
    p99: calcPercentile(durations, 99),
    stdDev: calcStdDev(durations, avg)
  }
  // ... then the same treatment for each phase
}
Sort once, pull percentiles by index, done. The stddev lives in shared
too and is the textbook sqrt(mean((x - mean)^2)). No external stats
library; I refuse to pull in simple-statistics or d3-array for 30 lines
of arithmetic.
#What the per-phase breakdown taught me
Running benchmarks on my own queries, I learned three things that surprised me.
Connect time is not zero. Even with pooling in a desktop client, the first few runs of a benchmark pay a noticeable reconnect cost. By run 10 it has settled. If your app creates a fresh connection on every query (hi, serverless), your production p99 is going to be dominated by that connection step and no amount of index-tuning will save you.
Plan time varies more than execute time for small, simple queries. If your query executes in 2ms but the planner takes 1–4ms of variable time, your query is effectively plan-bound. Prepared statements stop being "nice to have" and become the actual fix.
Fetch is where network latency hides. If you are running data-peek on your laptop against a remote Postgres, the fetch phase is where the round-trip tax shows up. Running the same benchmark on the same server against the same database will show you an entirely different fetch percentile. That is the real cost of remote development.
#What I'd do differently
I'd add a "warmup" option. Right now the first few runs are always slower than the rest because caches are cold. I report them as part of the distribution, which is honest but not always useful. A "discard first N" flag would make it easy to ask "what does the steady-state p99 look like?" without manually trimming the data.
I'd add a run histogram. p50/p90/p99 are summaries. A 20-bucket histogram would show you the shape directly — bimodal distributions (which almost always mean "cache hit vs cache miss") become obvious instantly. The BenchmarkResult has the raw durations, so this is a render-side change, not a data change.
I'd let you compare two benchmarks. "Did my new index help?" is the question. Right now you screenshot the before, run the benchmark again after, and eyeball the difference. A stored-comparison view would be the feature that actually ships index changes with confidence.
#Try it
Write a query. Click the Benchmark button. Pick 100 runs. Look at the distribution, not the average. That is the one-sentence pitch.
data-peek lives at datapeek.dev. The benchmark
path is src/main/ipc/query-handlers.ts (db:benchmark) and
src/main/telemetry-collector.ts (aggregateBenchmark) if you want to
read how it is wired. MIT source, free for personal use.